

ANALYTICS / BI

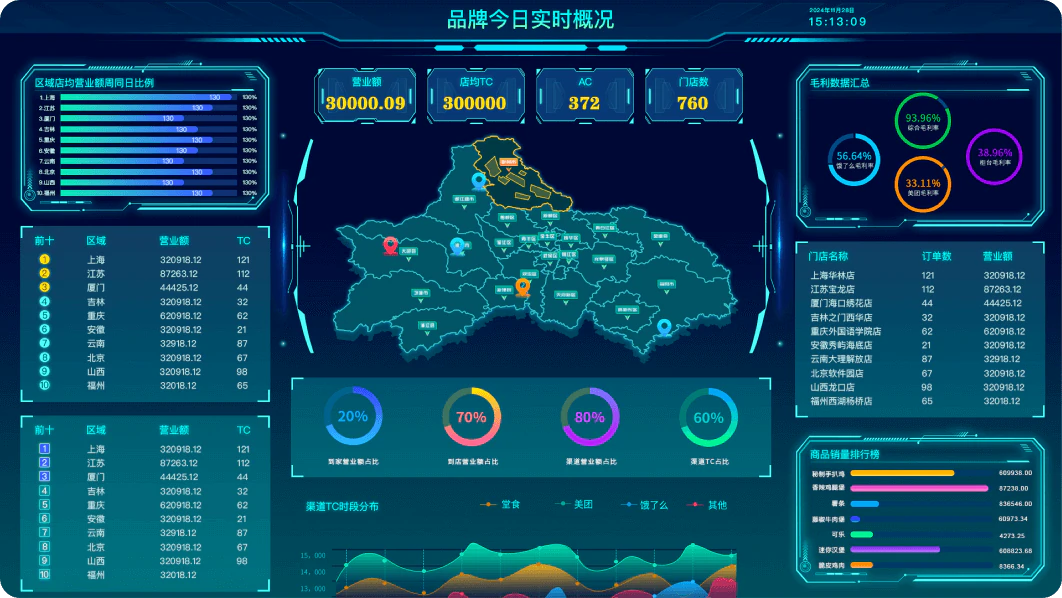
BI Dashboard

Turn sales, product, store, and member data into dashboards that guide the next action.

Discuss implementation
Connected operations represented by a digital city
Service WISHRAIN21 SMART RETAIL

Go beyond collection—make performance comparable

Normalize POS, ordering, membership, and inventory data into shared metrics and role-specific views for executives, regions, and stores. Explore change by period, location, item, and daypart.

Core capabilities

01

Executive summary

View revenue, traffic, average spend, gross profit, and prior-year change together.

02

Drill-down analysis

Move from company to store and category to item to investigate drivers.

03

Scheduled reporting

Standardize daily, weekly, and monthly reporting for faster distribution.

04

Early anomaly detection

Flag sudden sales decline, stockouts, or waste increases against defined rules.

Where it fits

  • 01Daily performance reviews across stores
  • 02Assortment and menu decisions
  • 03Pre/post campaign evaluation

Implementation approach

We review the site and existing systems, then introduce an operable scope in practical stages.

  1. 01

    Discover

    Review workflows, devices, network, data, and customer flow

  2. 02

    Design

    Define features, products, integrations, and delivery scope

  3. 03

    Deploy

    Install, configure, train, and validate in real operations

  4. 04

    Improve

    Use operating feedback and data to refine and expand

WISHRAIN21 / FUKUOKA

Discuss implementation

Tell us your store format, location count, existing equipment, and current challenges. We can start by structuring the requirements.

Discuss implementation